You can access your analytics reports by navigating to Analytics > AB Commerce Analytics in the menu bar. This will take you directly to your Analytics Dashboard. You can also access specific reports by clicking on the "More Details" links throughout the dashboard.
By default, the Top Products Report is displayed first. However, you’ll find a list of additional reports on the left-hand side of the page, allowing you to explore deeper insights into your store’s performance.
Date Range Selection
When viewing the dashboard or any report, you can choose a date range from a preset list or set a custom date range.
To select a custom date range, click on Custom Date Range, then use the dropdown to pick your From Date. Your next click will set the To Date.
By default, reports display data for the Last 28 Days, and your selection will be remembered as you navigate through different reports—until you close your browser.
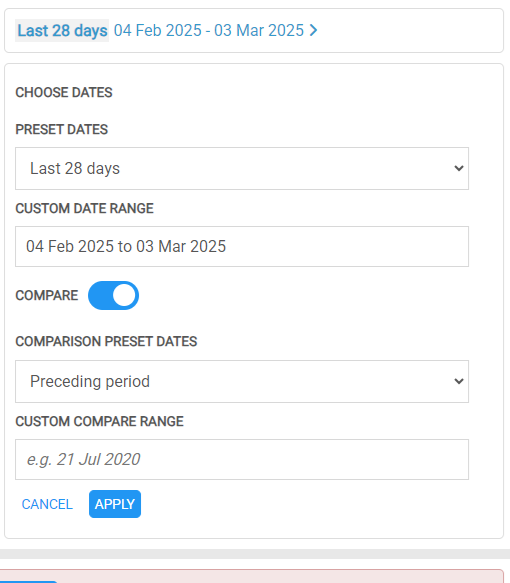
You can also click on COMPARE and then select a date range to compare against.
This also has preset options or you can set a custom date range to compare against.
Percentage Figures in Brackets
In the reports, percentage figures displayed in brackets represent the proportion of the total for that specific field.
For certain metrics, such as Conversion Rate or Average Order Value, the percentage in brackets indicates how that value compares to the overall average.
- If the value is more than 10% above the average, it will be highlighted in GREEN
- If the value is more than 10% below the average, it will be highlighted in RED
This color coding helps you quickly identify strong and underperforming areas in your data.
Reports
The following reports are now available:
| Report |
Description |
| Top Products |
This displays the top 500 products - you can change the view to be:
- By Revenue
- By Stock -
This analyses stock for a product.
We record stock at the start of each day - and if the product is INACTIVE, we record stock as ZERO for that day.
This report has some of it's figures adjusted to only calculate using days where there was stock at the start and at the end of the day. This is so that the figures are not skewed by days when there is no stock - or days when there is stock available but only for part of the day (e.g. before it sells out during the day).
Note that for products with versions, this is the sum of all their stock across all their active versions. We have a version breakdown of stock in another report when viewing a specific product's analytics.
- By Add To Basket -
This displays the ADD TO BASKET percentages for each product.
The Add % is the percentage of times a user clicked ADD TO BASKET when on the PRODUCT DETAIL page.
The Order % is the percentage of times a user completed their purchase after adding the product to their basket.
NOTE: The above % is adjusted to only use days where there was stock at the start and at the end of the day - this is so that the analytics are not skewed if a product is OUT OF STOCK when being viewed so can't be added to the basket.
The following are the report fields:
- Current Price: This is the current price of the product - for versions, this shows the average price across all versions
- Item Views: The total number of views of the product detail page for this product - this will display "N/A" if there was no stock recorded at the start of the date range (as stock is only recorded from when your analytics started running - while sales data is collected from the 1st day your website went live)
- Qty Sold: The total quantity sold for that product
- Orders: The total number of orders that included this product
- Revenue: The total revenue generated for this product
- Days InStock: This is the total number of days when there was stock at the start and at the end of the day
- Stock: The current stock level - for versions, this is the total stock when all version stock levels are added together
- Days OOS: This is the total number of days when there was no stock at the start or the end of the day
- Qty Sold Per Day: This is the average stock sold per day (when the product has stock both at the start and at the end of the day)
- Qty Sold (InStock Days): This is the total stock sold excluding days when there was no stock either at the start of the day or at the end of the day - this is used instead of Qty Sold when calculating the Qty Sold Per Day figure
- Added: The number of times a user clicked ADD TO BASKET when viewing the product detail page
- Add %: The percent of (ADDS TO BASKET / VIEWS) - excluding days when the stock at the start or end of the day was zero
- Orders: The number of times a user completed their order with this product
- Order %: The percent of (ORDERS / ADDS TO BASKET) - excluding days when the stock at the start or end of the day was zero
- Margin: Calculated as (PRICE - COST PRICE)
- Profit: The total PROFIT (MARGIN) from sales of this product
- Fast Sellers: These are the products with the highest Qty Sold Per Day
- Slow Sellers: These are the products with the lowest Qty Sold Per Day
- Regular OOS: These are products with the highest number of days when out of stock (Days OOS)
- Versions Fast Sellers: These are the versions with the highest Qty Sold Per Day
-
|
| Top Categories |
This displays the top categories.
This is based on the product detail page views and subsequent orders. It does not look at landing page views.
You can click on VIEW SUB CATEGORIES to drill down into the next level of sub-categories.
You can click on VIEW PRODUCTS to see the top products only in that category or sub-category.
The following additional field is available:
- Category Views - This is the number of times the landing page has been viewed (max 1 view per user session)
|
| Top Brands |
Similar to above |
| Top Search Terms |
This lists your top search terms.
The following are fields in this report:
- Searches: This is the total number of searches for this term (max 1 search term recorded per session)
|
| Top Related Products |
This shows the top related products for "Customers who Bought Also Bought" and for "Customers who Viewed Also Viewed".
This report is MONTHLY ONLY as we record these analytics month by month and not day by day - so the date range is always from the start of the month to the end of the month.
You can view this by the following:
- By Revenue or By Qty Sold - this is for Customers who Bought Also Bought
- By Views - this is for Customers who Viewed Also Viewed
The following are the fields in the report:
- Product - this is the product A
- Related Product - this is product B
- Price - this is the price of product A
- Related Price - this is the price of product B
- Related Revenue - this is the price of product B X qty sold of product B
- Related Qty Sold - this is the qty sold of product B
- Related Views - this is the number of sessions that product A and product B were viewed together in the same session
|
| Top Related Search Terms |
This lists your top search terms used together in the same user session.
The following are fields in this report:
- Searches: This is the total number of searches for this term (max 1 search term recorded per session)
|
Right Sidebar
Beside some reports, a sidebar may appear on the right side of the page with the following:
| Website Summary |
For certain reports, the website summary will appear on the right side with the following fields for the date range:
- Revenue - total revenue for the date range
- Conv Rate - true conversion rate for the date range - this is calculated as NUMBER OF ORDERS divided by SESSIONS WITH 2 OR MORE PAGES
- Avg Ord Value - the average order value
- Orders - the total number of orders
- Sessions - the total number of sessions with 2 or more pages
- ALL Sessions - the total number of sessions including robots and anything that accesses a page on the website
- Qty Sold - the total qty of products sold
- Av Ord Qty - the average number of products in an order
- Baskets to Orders - the % of add to baskets that resulted in a complete order
|
| Product Summary |
When you click View Product Analytics for a single product, this appears on the right side of the page |
| Category Summary |
When you click View Sub Categories beside a category, this appears on the right side of the page with the following fields for the date range:
- Revenue - total revenue for the date range
- Qty Sold - the total qty of products sold
- # Orders - the total number of orders
|

Comments
0 comments
Please sign in to leave a comment.